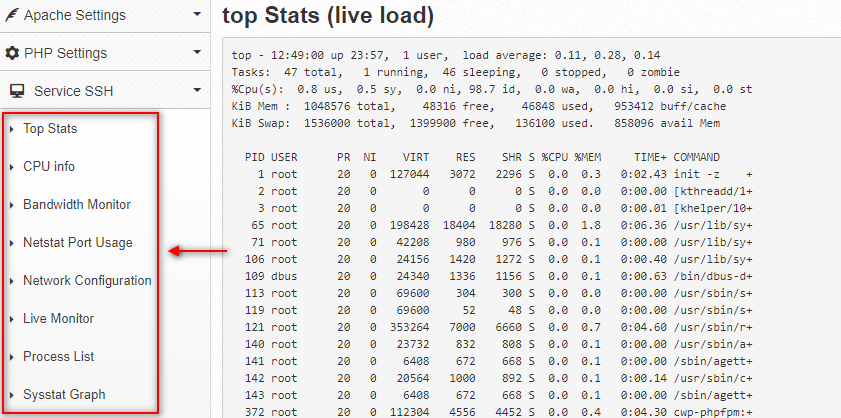
From time to time it’s a good idea to check your web hosting server activity. CWP offers you some tools to check the CPU information, server load, network port usage, bandwidth usage, active process list etc.

To view the server stats in CWP:
- Enter your CWP admin area
- Look for Service SSH menu
- Here you will see more entries that will display various server stats:
– Top Stats – this is equivalent to the top command
– CPU info – displays processor info; it’s equivalent to the cat /proc/cpuinfo command
– Bandwidth Monitor – bandwidth monitoring on all interfaces.
– Live Monitor – equivalent to the top command plus the mysqladmin processlist and mysqladminstatus
– Process List – output similar to the ps -aux command.
You can get much more information using variations of the above commands in a terminal window.
The short video tutorial for this article:

Hi
We want to monitor multiple hosts on AWS?
How to add multiple hosts to monitor ?
is it completely open source?
Thanks and Regards
Justin
Hello Justin, I think you are looking for a site monitoring service – like site24x7.com, freshworks.com/website-monitoring/ etc.
In this post are server stats for the CWP control panel.