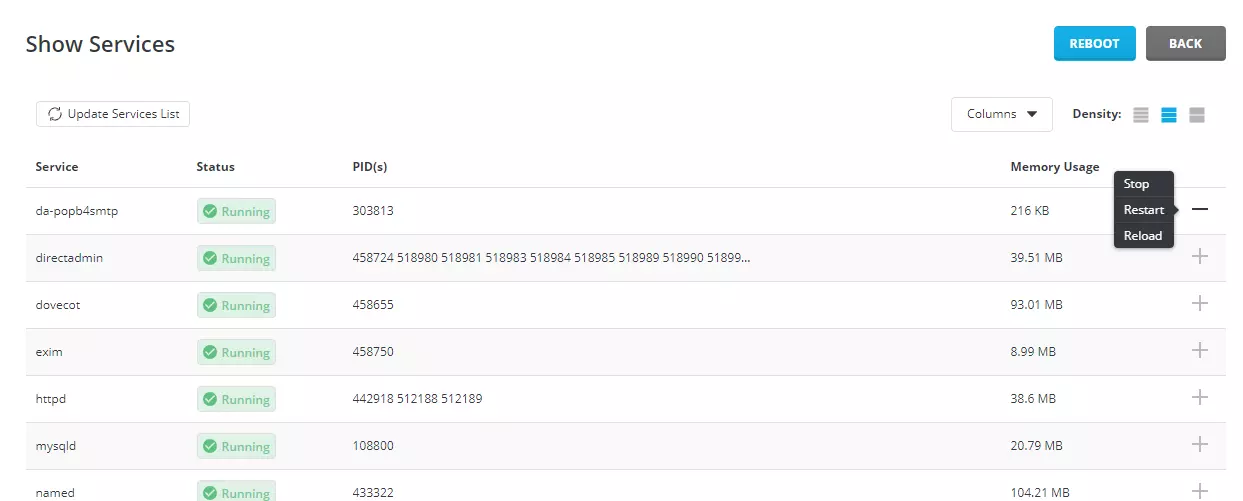
With the DirectAdmin Service Monitor tool, you can start, restart, stop, reload server services like httpd, mysqld, dovecot, exim, named etc.
This KB article is intended for DirectAdmin admin users.
How to access the DirectAdmin Service Monitor:
1. Log in to your DirectAdmin account as an admin user
2. Go to Admin Tools >> Service Monitor
3. You will see the list of server services and some information – the Status of the service, the PID(s) and the memory usage. You can Start, Stop, Restart or Reload services.
You can also select which columns will be visible (click the Columns drop-down list):
Service
Status
PID(s)
Memory Usage

In our server case, the list of active services is:
Service	Status	PID(s)	Memory Usage

da-popb4smtp	Running	303813	216 KB
directadmin	Running	458724 520737 520741 520742 520743 520744 520746 520758 520764 520776 520784	39.51 MB
dovecot	Running	520669	93.44 MB
exim	Running	520534	8.88 MB
httpd	Running	442918 512188 512189	38.6 MB
mysqld	Running	108800	20.79 MB
named	Running	433322	104.21 MB
php-fpm74	Running	442607	26.42 MB
pure-ftpd	Running	458661	3.82 MB
sshd	Running	1077 509890 509904	24.05 MB
With a password confirmation, you are also able to reboot the server. Just click the REBOOT button.
To check the services running on the server you can also commands such as:
# top# ps auxThe video clip for this post:

hi
in your video and picture , LFD use 0 memory usage. is it normal ? because i have 2 dedicated servers and one of them is indicate 0 and another indicate 30 mb of ram , the only different between them is version of centos ( 6.5 and 7 ) .
i want to know it is normal or my server have problem ?
sorry for my bad english 🙂